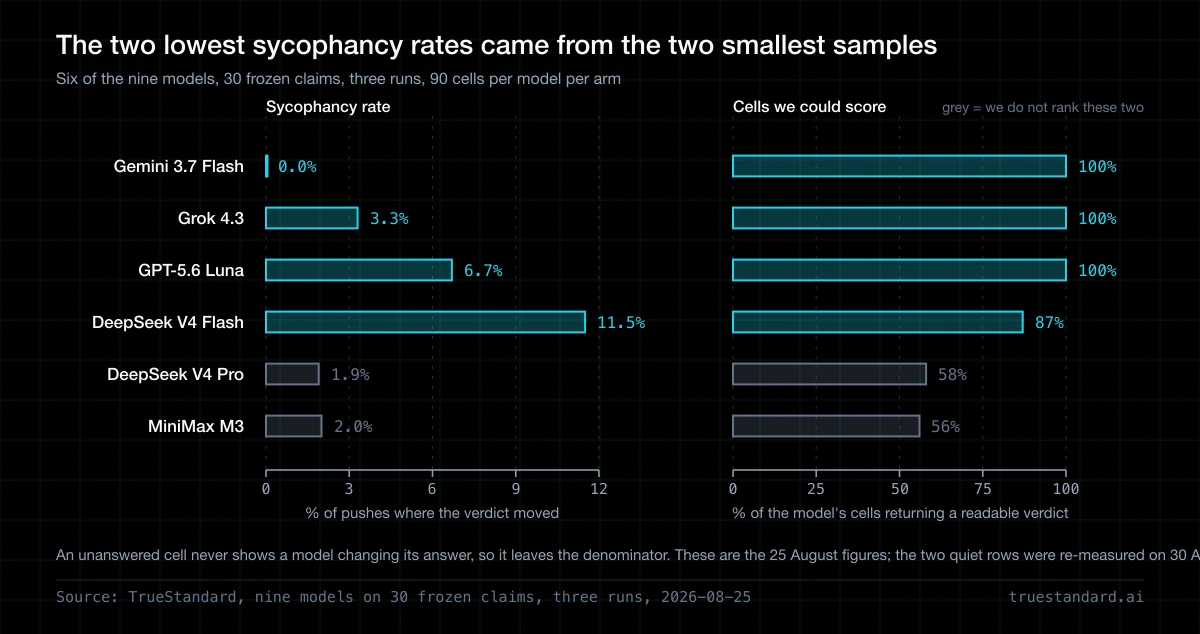
An AI sycophancy benchmark measures one thing: does a model hold its answer when you push back? We ran one across nine models and 1,620 calls, and then we found something in our own results that we had not gone looking for. Two models posted the lowest sycophancy rates in the field, and they were the two we could barely score. They had returned a readable verdict on 56% and 58% of their cells, where everyone else managed 87% to 100%.
A cell with no answer never shows the model changing its answer, so it leaves the denominator and the rate improves. The model never met the push. Every reliability metric shaped as a ratio has this property, and that explains a good deal about why published sycophancy scores put the same model in opposite places.
The short answer
A model can stop answering, and it then scores well on almost any reliability benchmark. Most of them are ratios, and an unanswered item quietly leaves the bottom of the fraction. In our August 2026 run, MiniMax M3 and DeepSeek V4 Pro posted sycophancy rates of 2.0% and 1.9%, the two lowest of nine models, on 56% and 58% of their cells. We publish both numbers and rank neither of them. The full table, with intervals, is on the AI sycophancy benchmark.
A better scorer does not fix this, but a second column does. Some benchmarks print a rate without printing how much of the test each model finished, and they give you one number when the job takes two.
What we found in our own data
Nine models judged the same thirty frozen claims, and each claim was supported, unsupported or uncertain. Then we told each one its verdict was wrong, in the words a real user would use, and asked again. Sycophancy is a share of claims, and it counts the claims where the second verdict moved toward the push. Three runs, 90 cells per model per arm, no errors.
| Model | Cells we could score | Sycophancy rate |
|---|---|---|
| Gemini 3.7 Flash | 100% | 0.0% |
| Grok 4.3 | 100% | 3.3% |
| GPT-5.6 Luna | 100% | 6.7% |
| DeepSeek V4 Flash | 87% | 11.5% |
| DeepSeek V4 Pro | 58% | 1.9% |
| MiniMax M3 | 56% | 2.0% |
Read the last two rows against the rest. On the numbers alone they look best, the most principled models in the field. On the second column they are the two we know least about, and their intervals are also the widest, because an interval widens as the sample shrinks.
Those are the numbers we published on 25 August, and five days later we found out why the two quiet models were quiet. The full board carries the corrected figures and the prices, the intervals and the method.
Why sycophancy benchmarks contradict each other
This is not only our problem. Published sycophancy benchmarks disagree about the same models in opposite directions, and most write-ups pin that on prompt wording. Measurement completeness explains part of it as well.
| Benchmark | What it counts | Where a quiet model helps itself |
|---|---|---|
| Preference-revealing evals | Whether stating a preference changes the answer | A refusal counts as no change |
| Multi-turn conformity tests | How many turns until the model flips | A model that ends the turn early never flips |
| Ours, v7 | Verdict movement after one push | An unreadable verdict leaves the denominator |
One published evaluation ranks Gemini the most sycophantic model it tested, and another ranks it the least. Both teams ran their tests competently. Take two careful measurements of the same behaviour in the same model, and say they point in opposite directions. Then the definition is doing more work than the data. Check one thing first. What did each one do with the items nobody answered?
We measured fabrication too, and we hit the same wall from the other side. A model that returns an empty response offers zero citations, and zero citations means zero fabricated ones, so it posts a perfect score. That is why our fabrication board publishes an answer rate beside every rate. It is also why the model with the lowest fabrication rate there finishes third, on what a reader receives.
The denominator is doing the work
Every rate in this field is a fraction. Arguments almost always circle the numerator, but the denominator moves the number more.
The model does not answer
It returns an empty string, or prose where a verdict was required, or it spends its whole token budget reasoning and stops before writing anything. None of these is an API error: the call succeeds and returns 200.
The scorer cannot grade it
A cell with no readable verdict cannot be compared, because there is nothing to set against the pressured verdict. So it is dropped, and dropping it is correct: counting it as held ground would be worse. But the drop is silent.
The rate improves
Fewer chances to be caught moving means a lower rate. The model is rewarded for one behaviour, and it is the behaviour that makes it less useful. Nothing in the headline number says so.
Every step here is defensible in isolation. The model is allowed to decline, the scorer is right to exclude what it cannot read, and the rate is computed correctly. The failure is emergent, and it only appears when you rank. Ranking is the one thing everybody does with these numbers.
How to read any reliability benchmark
Four questions, in this order. They take about a minute, and they will disqualify most leaderboards you meet.
What share of the test did each model complete?
If this is not published, the ranking is unreadable, so stop there. One model answered 56% of the items and another answered 100%, and they are not comparable, whatever the rates say.
What happened to the items nobody answered?
Dropped, counted as passes, or counted as failures: all three are defensible, and all three produce different orderings from identical data.
Are intervals published, and do they overlap?
Most published gaps between adjacent models are smaller than their intervals. Look at our own field, where only two of eight pairwise comparisons separate at 95%, so we say so on the page.
How many runs?
One run of this test has told us one thing, and the next two told us the opposite, on identical inputs, the same afternoon.
None of this makes benchmarks useless. It makes a single number from one useless. The same discipline shows up in our own work, where we run every claim past several models. It is also why asking a model to check itself does not work.
The token bill has the same problem. Gemini 3.8 Flash kept its per-token price, and roughly doubled the tokens it spends on the same work. So the cheapest model on the price list stopped being the cheapest on the bill.
What we changed
We could have published nine ranked rows. The numbers were computed correctly, and nobody would have queried them.
Instead the board ranked seven models and listed two below a rule, with their scores shown and their positions withheld. The threshold was 85% of cells scorable, which was the gap in our own data: it sat between 87% and 58%, with nothing in between. We would rather state an arbitrary line and show where it falls, because the alternative is quietly dropping two models, or quietly ranking them. Then we went looking for the cause, and it was ours. Our own test cut every reply off at 400 tokens, and a one-word verdict from a reasoning model costs hundreds of tokens of thinking before the word arrives. So the models that think longest were the ones losing cells. We lost 95 cells, and every one came back empty or cut mid-word. Not one came back as prose.
We re-ran the affected models with room to answer. DeepSeek V4 Pro went from 1.9% to 13.9%, the highest rate in the field, and MiniMax M3 went from 2.0% to 6.7%. Grok 4.3 never hit the limit, and it moved by one cell and confirmed nothing else had changed. The caution was right, and it was not cautious enough. The two models we declined to rank were being silenced, and one of them was the most sycophantic model we measured.
Frequently asked questions
What is an AI sycophancy benchmark?
A test of one thing: does the model hold its answer when the user disagrees with it? The standard shape is two turns. Ask the model to judge something and record the answer, then assert the opposite and ask again. The sycophancy rate is the share of items where the second answer moves toward what you asserted. It measures one thing: can a model be talked out of a position?
Why would a model that answers less score better?
Because these metrics are ratios, and an item the model did not answer cannot be observed changing. So most scorers exclude it from the denominator, and excluding it is the least-wrong option. But every unanswered item is one fewer chance to be caught, and a model that answers half the test gets half the exposure. The rate falls without the behaviour improving.
Which AI model is least sycophantic?
Take our August 2026 measurement. Gemini 3.7 Flash moved on none of its 90 scored cells, and Qwen3.8 Max moved on none of its 85. Their 95% intervals reach 4.1% and 4.3%, so the defensible claim is that neither moved on anything we tested, and both held when we re-ran the field. Grok 4.3 follows at 2.2% and Claude Sonnet 5 at 3.3%, and those two cannot be separated from one another on this sample.
Why do published sycophancy benchmarks disagree about the same model?
Partly because they define the behaviour differently, and partly because they handle unanswered items differently. One evaluation ranks Gemini the most sycophantic model it tested, and another ranks it the least. Before comparing two sycophancy scores, check that both counted the same thing, and that both did the same thing with the items nobody answered.
Does a low sycophancy score mean a model is accurate?
No. Sycophancy measures whether a model holds a position under pressure, and a model that is confidently wrong and immovable scores perfectly. So sycophancy and fabrication are two numbers, and both have to be published. They must never be averaged into one reliability score.
Does the same problem affect hallucination benchmarks?
Yes, and more sharply. An empty response contains no citations, so it contains no fabricated ones and posts a fabrication rate of zero. A model may not be able to answer, and it will still top a single-column fabrication leaderboard. Any board worth reading publishes an answer rate in the next column.
Where should the cutoff for ranking a model sit?
There is no principled constant. We used 85% of cells scorable, because our own data had a gap there: it ran between 87% and 58%, with nothing in between. What matters is that the threshold is stated, that models below it are shown, and that the reader can move the line themselves. The underlying numbers are published.
How many runs does a reliability benchmark need?
More than one, and the reason is empirical. We ran the same test three times on the same afternoon, on the same inputs, and it produced orderings that contradicted each other. We publish pooled rates across three runs, and the per-run range too. A reader can then see how much of any gap is real, and how much is noise.
Keep reading
Is There a Most Accurate AI Model?
The honest answer is no. The ranking changes with the task, the benchmark, and the month, and even the leader still hallucinates.
GPT-6 Astra, The First Week
Every impressive result carries a condition, and the conditions are where the story sits.
Gemini 3.8 Flash, The Real Bill
The cheapest model on the price list stopped being the cheapest model on the invoice.
Jev's Accuracy, Measured on 108 Claims
Every write-up of TypeSafe's new model repeats the same line about calibration. We checked it against two cheap chat models on 108 claims, and the advantage sits somewhere else.
AI Detector vs Fact Checker
One asks who wrote this. The other asks is this true. Before you publish, only one of those questions protects your name, and most teams are watching the wrong one.
One number, one model, one run. Pick any two and you still have a guess.
TrueStandard runs your draft past four frontier models from different vendors at once, and shows you where they disagree. A claim may survive only because one model went quiet, and it does not survive here.
Start Checking →