Claude Fable 5 leads a benchmark run by Artificial Analysis that tests knowledge and hallucination. It scores 40, the highest recorded. That does not mean it hallucinates less than other models. They say so themselves: accuracy drives that score, not low hallucination.
The scores above come from Artificial Analysis's published write-up, and we link it so you can check us. Update, 3 September 2026: we have now measured Fable 5 ourselves, on thirty claims, run three times. It invented 3 of the 137 DOIs it offered, which is 2.2 percent. A Grok 4.3 control hit 8.9 percent on the identical set. Its successor is indistinguishable from it, and full numbers are on the Claude Fable 5.1 release page.
What the benchmark actually says
AA-Omniscience asks 6,000 questions across 42 topics. It awards points for a correct answer and subtracts them for a confident wrong one. It treats an honest "I don't know" as neutral. A model earns nothing for guessing.
Fable 5 scores 40, seven points above the previous leader, Gemini 3.1 Pro Preview.
“This score is driven by leading accuracy (percentage questions correct), rather than low hallucinations.”
Artificial Analysis, on Claude Fable 5's AA-Omniscience result
A model can climb a hallucination benchmark by knowing more, without having to invent less. Those are two different virtues, and only one of them is what you want. You are about to publish something it told you. The 600-question public subset is on Hugging Face, so go there if you want the raw set.
Three things the number hides
None of this is a knock on Artificial Analysis, which publishes every one of these points. It is a knock on reading one number and stopping there.
The index adds accuracy and hallucination together
The index rewards correct answers and docks wrong ones, and both sit inside a single score. A model can know a lot and still make things up. It lands in the same place as a careful model that knows less. You cannot pull the split back out of the total.
Nine percent of the answers came from a different model
Artificial Analysis notes a fallback: on 9% of AA-Omniscience questions, Fable 5 hands off to Opus 4.8. So take roughly one answer in eleven, which did not come from the model named on the leaderboard row.
The configuration changes the score
The same model reports different results under different settings. Change the reasoning effort or the fallback and the score moves. Quote a number without its settings and no one can run it again. Getting the same result twice is what makes a benchmark a benchmark.
One number cannot answer the real question: is this model safe to publish from? That is why we run every claim past four models, from different vendors. We do not trust one.
The same confound in our own data
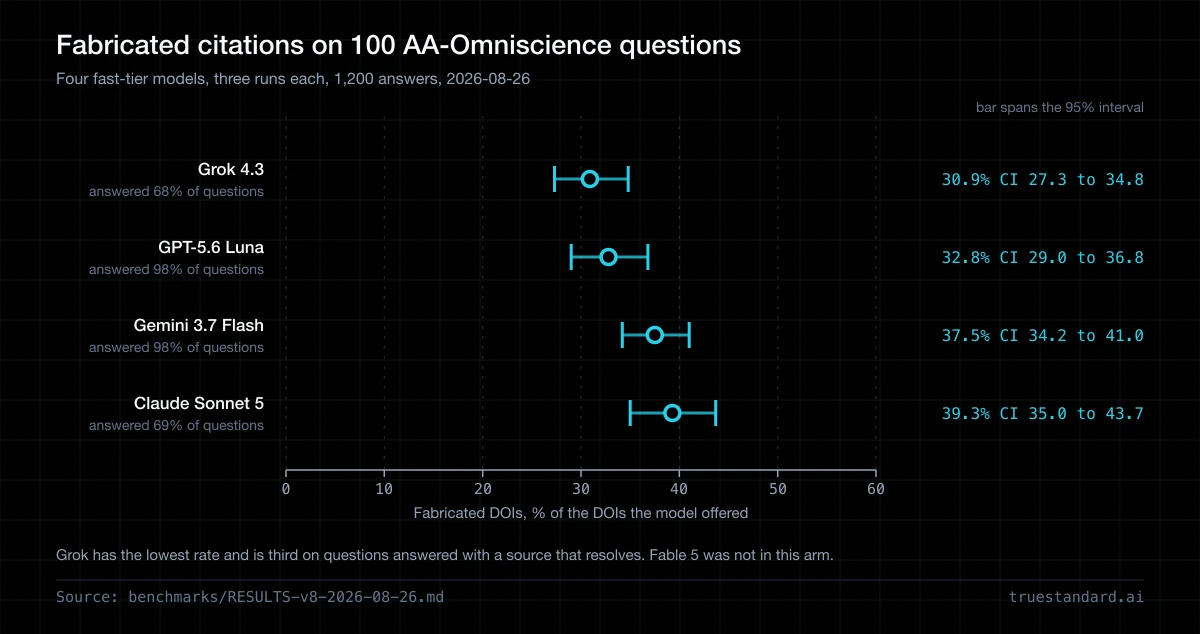
On 26 August 2026 we ran 100 questions past four fast-tier models, three times each. We sampled them from that same public AA-Omniscience set. That comes to 1,200 answers. That arm did not include Fable 5. A separate arm on 3 September 2026 did, and its numbers are on the Fable 5.1 release page. Both ask a narrower question than Artificial Analysis does. When a model cites a source, does the source exist?
We checked every citation against the two registries that hand out DOIs: Crossref and DataCite. A DOI either resolves or it does not. So there is no judge model, and no opinion anywhere in the scoring.
Fabricated citations across three runs, 100 questions
| Model | Answered | Fabricated | 95% CI | Answered with a real source |
|---|---|---|---|---|
| Gemini 3.7 Flash | 98% | 37.5% | 34.2–41.0 | 42% |
| GPT-5.6 Luna | 98% | 32.8% | 29.0–36.8 | 49% |
| Grok 4.3 | 68% | 30.9% | 27.3–34.8 | 30% |
| Claude Sonnet 5 | 69% | 39.3% | 35.0–43.7 | 27% |
Grok 4.3 has the lowest fabrication rate in that table, and it comes third on being useful. It earns the low rate by refusing, having declined roughly a third of the questions. Gemini and Luna answered almost everything. Rank on fabrication alone and you crown the model that says least.
The refusals are spelled out, and they are not blank responses. Both are the right thing to do, and neither shows up in a fabrication rate. Claude Sonnet 5 returns "I don't have verified sources for this specific claim." Grok 4.3 returns "No sources found."
The two numbers you need
Any honest number here needs a partner. One number tells you how often the model speaks, and the other tells you whether what it said was real. Apart, each is easy to game.
- • How often does it answer? A model that keeps refusing looks flawless on error rate, and it is also useless.
- • When it answers, how often is that answer checkable? This is the number that decides one thing: can you publish without checking the lot by hand?
Artificial Analysis built this into their design, and they treat a refusal as neutral instead of free. Vectara does the same, and publishes an Answer Rate column beside its hallucination rate. Any leaderboard without that second column rewards staying quiet. The successor model shows the same math running the other way. Fable 5.1 answers more and scores worse for it.
This is why our runs report what each model refused to back, not just what it got wrong.
A surprise in the fabrications
Across all 1,200 answers our models emitted 975 dead DOIs, and 946 of them were distinct. Only two were invented by more than one model. We expected a lot of overlap, and the theory was simple. Models train on similar corpora, so they should land on the same plausible fakes. They mostly do not, and each model invents its own.
Say you hope to catch fabrications with a shared blocklist. That matters, because there is no common set of fake citations to filter against. There was some overlap, on well-formed IDs in big-name journals, and that is the pattern worth watching.
How we measured
- — 100 questions sampled with a fixed seed from the 600-question public AA-Omniscience subset, stratified by topic. Four models, three runs each, temperature 0, no web access.
- — Health and science topics only, because our scorer resolves DOIs. Questions in law or finance are properly sourced, and they point to statutes and standards that carry no DOI. Scoring those would measure our tooling, not the model.
- — The fabrication rate is a lower bound. A further 23–44% of citations resolved to a real paper whose title did not match the claim. Those sit in a manual review queue, and we do not count them as failures. So real miscitation is higher than the table shows.
- — We re-ran a control model on our older claim set, and it landed at 10.9%, inside its established 7.1–11.4% band. So we know where the higher rates come from. They come from harder questions, not from a bug in our tooling.
- — You cannot compare these figures to our earlier published rates of 6–11%. Those used 30 general claims, and these are 100 hard domain questions. The jump is the corpus, the set of questions we asked. It is not a fall across the whole industry.
- — We tested fast-tier models, and Fable 5 is a flagship and is not in this table. Nothing here is a measurement of Fable 5.
Each model here ran at one effort setting. For how the setting itself changes the rate on Claude, see our effort test on Sonnet 5 and Opus 5.5.
FAQ
Does Claude Fable 5 hallucinate less than other models?
Not according to the benchmark it leads. Fable 5 scores 40 on AA-Omniscience, the highest recorded, but Artificial Analysis credits higher accuracy, not lower hallucination. The index folds both into one figure, so a top score does not show that it fabricates less often.
What is Claude Fable 5's AA-Omniscience score?
40. That is seven points above the previous leader, Gemini 3.1 Pro Preview. Artificial Analysis also notes a fallback. On about 9% of the benchmark's questions, Fable 5 hands off to Opus 4.8, so part of that score reflects a different model's answers.
Why can a model top a hallucination benchmark without hallucinating less?
Because most of these scores mix two things into one number: one is accuracy, and the other is fabrication. Points earned for knowing more offset points lost for inventing things. Two models can fail in very different ways and still land on the same score. The total does not let you tell them apart.
Is a low hallucination rate always good?
No. A model that refuses most questions posts a great error rate, and it is also useless. Take our own testing. The model with the lowest fabrication rate declined roughly a third of the questions, and it ranked third on one thing. How often did it produce a source that actually existed? Read the answer rate next to the error rate.
Can I check these numbers myself?
Yes. The Fable 5 figures come from Artificial Analysis, and their published article is linked above. The 600-question corpus we sampled is public on Hugging Face. Our own run files and scoring output are in the repo, in our benchmark folder.
Keep reading
Is There a Most Accurate AI Model?
The honest answer is no. The ranking changes with the task, the benchmark, and the month, and even the leader still hallucinates.
Does GPT Hallucinate Less at Higher Reasoning Effort?
We asked GPT-5.6 Luna for sources on the same 30 claims at all five of its effort levels. Then we checked every DOI it gave us against the real registries.
Does Gemini Hallucinate Less With More Thinking?
We asked Gemini 3.7 Flash for sources on the same 30 claims at all four of its thinking levels. Then we checked every DOI it gave us against the real registries.
Does Reasoning Effort Reduce Hallucinations?
We asked four models from three labs for sources on the same 30 claims, at each effort level. Then we checked every DOI against the real registries.
An Originality.AI Alternative
Originality.AI is a strong AI-detection suite. But say the job you care about is verifying claims before you publish. Fact-checking is only one of its five bundled checks, and it runs on a single model.
What we measured on this model
Each release page carries our own fabrication data for one model version, measured against the model it replaced in the same vendor's line.
Check the claim, not the leaderboard
Benchmarks tell you how a model behaves on average, across thousands of questions. They cannot tell you about the paragraph in front of you: is that one true? TrueStandard runs your draft past four models from different vendors, and shows you every point they disagree on.
Verify a draft