AI hallucination benchmarks disagree for one reason: a hallucination rate is a property of the test. Take one generation of models. It scores under 2 percent on a grounded summarization leaderboard, and the same generation scores over 60 percent on an open-domain factual test. We keep a sourced reference of that spread. Every explanation of this compares benchmarks built by different people: different corpora, different scorers. Three variables move at once, so the cause stays a matter of inference.
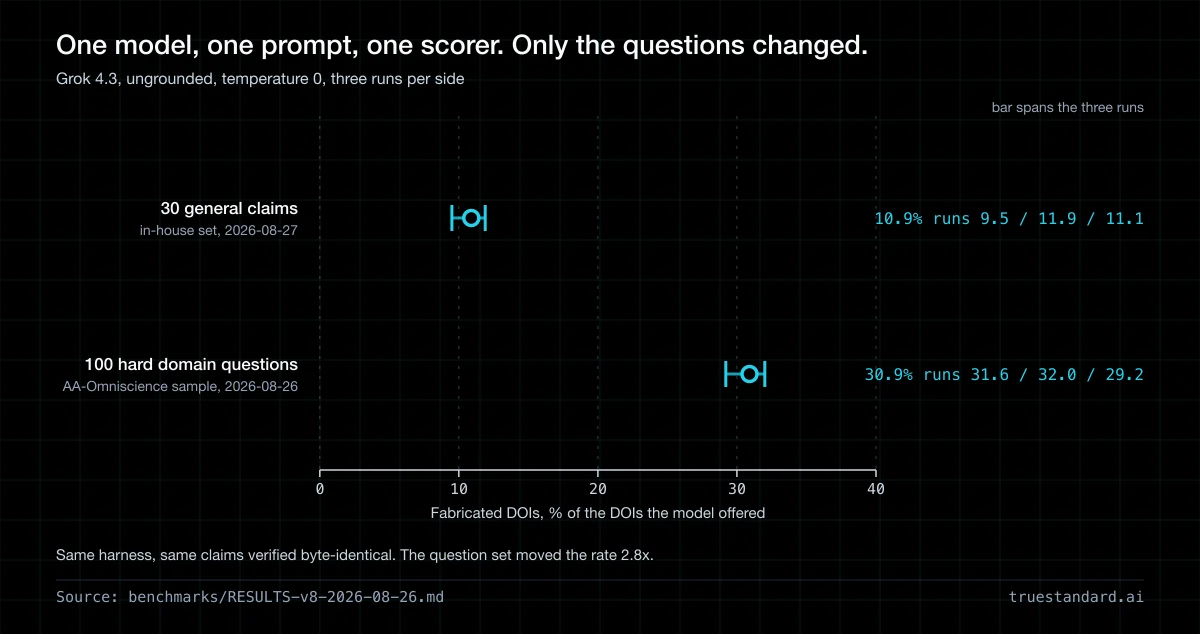
We had the test harness to hold two of them still: same model, same prompt, same scorer, three runs on each side. One thing differed, the questions, and fabrication went from 10.9 percent to 30.9 percent. The control that backs it passed.
The short answer
Hallucination benchmarks disagree because they ask different questions, and the questions move the number about as far as the model does. We measured both on one test harness. Changing the question set moved a single model from 10.9 percent to 30.9 percent. Then we changed the model instead: nine of them ran on a fixed question set, and the rate spanned 8.3 to 33.1 percent.
A rate quoted without its benchmark named carries almost no information. Someone tells you a model hallucinates 4 percent of the time; they have told you about a test.
What moves a fabrication rate
| What changed | What was held still | How far the rate moved |
|---|---|---|
| The question set | Model, prompt, scorer, 3 runs | 10.9% to 30.9% |
| The model, nine of them | Question set, prompt, scorer, 3 runs | 8.3% to 33.1% |
| Nothing, the same test re-run | Everything | 1.3 to 7.2 points |
Row one is the v8 control arm of 2026-08-27, row two the v7 field arm of 2026-08-25, and row three the v8 field arm of 2026-08-26. All three are three runs at temperature 0, and every DOI was scored by resolving it against Crossref and DataCite.
Everyone already says it depends
On 26 August a product writer published a head-to-head covering ChatGPT, Claude, Grok and Gemini across ten use cases. It is a careful video.
Coding goes to ChatGPT, and then comes the caveat. An engineer friend who reads the code prefers Grok, and his grounds are simple. GPT and Opus over-engineer what they are asked for. The video's author says that the code goes unread. One thing separates the two reviewers: did anybody inspect the artifact?
That is the visible version of this problem. Design, video and personality can be judged, because you look at the output. Whether the model told you the truth cannot, so the question gets handed to a benchmark. The benchmark inherits the same dependence and buries it in a methodology section. We have written separately about what capability rankings leave out. This piece is about the thing that replaces them, and how far it can be trusted. How far a small corpus can be trusted is its own trap. A later study of ours reversed its conclusion twice on the way from 22 claims to 108. We show it in Jev's accuracy, measured on 108 claims.
The experiment that isolates it
An arm we ran on 26 August put four models on 100 questions sampled from AA-Omniscience, a public benchmark corpus published by Artificial Analysis. Grok 4.3 fabricated 30.9 percent of the DOIs it offered. Every earlier arm ran on 30 claims we wrote ourselves, and there the same model had landed between 7 and 13 percent. We hold a reference band of 7.1 to 11.4 percent for it.
Read one way, the control had failed and something in the tooling had broken. Nothing had. A reference band cannot cross a change of corpus, and carrying it over unexamined was our design error. The fix was to stop inferring and run the variable on its own.
So we went back. The old claim set went through the same test harness: same model, same prompt, same scorer. First we verified the claims matched byte for byte, then three runs, the way every arm runs.
Grok 4.3 on the old claims, run again on 2026-08-27
| Question set | Run 1 | Run 2 | Run 3 | Pooled |
|---|---|---|---|---|
| 30 general claims | 9.5% | 11.9% | 11.1% | 10.9% |
| 100 hard domain questions | 31.6% | 32.0% | 29.2% | 30.9% |
Pooled 10.9 percent, inside the band. That is identical to an earlier score the same model set in the field arm two days earlier.
One model, one prompt, one scorer, three runs a side, and roughly three times the rate. Every published disagreement about hallucination rates is made of this, and it usually goes unmeasured. Isolating it costs a second arm that produces no leaderboard.
One run on one corpus would have produced a confident number, with no way to know that it was a number about the corpus. The same reason applies to your draft: a single model's verdict on it is not evidence. TrueStandard runs your text past four or five models in parallel and shows you every place they disagree.
What the tripling does not prove
Two things changed between the corpora at once. Our 30 claims were general and written in-house. The 100 questions are harder, drawn from a third party, and confined to health and science. The sets also differ in size.
So here is the finding: the question set dominates the model choice, but it does not separate difficulty from subject matter. A cleaner arm would vary one at a time.
Two further limits apply to every number on this page. Fabrication rate is a lower bound on wrongness. Models offered DOIs, and between 23 and 44 percent of them resolve to a real paper whose title does not match the claim. Those sit in a review queue instead of counting as failures. And correctness is not measured, because grading it needs a model judge. That would import the judge's own preference for its own output. The benchmark was built to expose exactly that.
Two rankings, same nine models
The question set is not the only thing that reorders a leaderboard: the failure you choose to count does it too.
In an arm on 25 August we put nine models through 1,620 calls, scoring two failures at once. One was invented citations; the other was caving to a confident user who pushes back on a correct answer. Both get sold as reliability. The two rankings correlate at a Spearman rho of 0.62, which is related and nowhere near the same.
Two of the nine are missing from this table on purpose. The sycophancy arm capped model output at 400 tokens where the citation arm allows 3,000. Two reasoning models lost cells to truncation, roughly two thirds of one stratum. They are MiniMax M3 and DeepSeek V4 Pro, and that leaves 50 and 52 scored cells, against 85 to 90 for everyone else. The cells vanished from the half where a model caves, so both rates are floors on a reduced sample. Neither can be ranked against the rest. The correlation above is the published figure across all nine, and recomputed on the seven with full samples it is slightly stronger. So dropping them does not rescue the idea. One number would still not do.
The same nine models, ranked by two failures
| Model | Fabrication rank | Sycophancy rank | Shift |
|---|---|---|---|
| Gemini 3.7 Flash | 5 | 1 | -4 |
| Qwen3.8 Max | 4 | 2 | -2 |
| Grok 4.3 | 3 | 6 | +3 |
Gemini 3.7 Flash sits mid-field on invented sources, and it never moved a verdict under pressure across 90 pressured cells. Claude Sonnet 5 is four places better on fabrication, and moves on 3.3 percent of them. One buyer fears fabricated sources, another fears a model that agrees with whatever the user says, and they are shopping for different models.
One number cannot hold two failure modes that disagree at rho 0.62, and one model cannot tell you which of them just happened. Not on your draft. Four models checking the same paragraph will split, and where they split is where a human should look first.
A low rate can be bought with silence
Take the 100-question corpus. Grok 4.3 had the lowest fabrication rate of the four models tested, and it also answered the fewest questions. Grok answered 68 percent of them, Claude Sonnet 5 answered 69, and Gemini 3.7 Flash and GPT-5.6 Luna answered 98.
Rank instead by questions answered with a citation that resolves, and Grok comes third. A model that refuses every question fabricates nothing. It also helps nobody, so a leaderboard built on fabrication alone rewards declining to answer.
A rate hides one last thing: how much of it is real. The nine-model arm has 36 model pairs, and of those, 16 separate at p below 0.05 by a two-tailed Fisher exact test. The extremes are solid, but the middle four models are one blur and no ordering among them is supportable. On the harder corpus, Grok against Gemini overlaps, and so does Gemini against Sonnet 5, so neither pair can be ranked at all.
How to read any hallucination rate
Five questions do the job and turn a quoted rate back into something you can use.
On what corpus?
Named, public, and sized, because the corpus moved our own number three-fold.
Grounded or ungrounded?
Summarizing a supplied document is one task, and recalling a fact unaided is another. There is a gap between the 2 percent figures and the 60 percent figures, and most of it is this.
How many runs?
One run is a single draw, and our re-runs of an identical test moved between 1.3 and 7.2 points. One run once broke that and put a passing control outside its own band.
What counted as a failure?
Ask what happens to abstention: is it rewarded, punished, or quietly scored as a pass? It decides who tops the table.
Who scored it?
A registry lookup can be checked by you. A model judge cannot, because it brings its own preferences to a question about model output.
Try them on the public boards first. We did it for Artificial Analysis's board, next to our own numbers for the same five models, in what the hallucination leaderboards measure.
Run those five questions on the next accuracy claim you are shown. A number that survives all five is worth acting on, and a number that survives none is a marketing asset. Ours are on this page, where the corpus is named and the runs are counted. Check them.
Frequently Asked Questions
Why do AI hallucination benchmarks disagree?
Because they ask different questions, and the questions move the result about as much as the model does. We ran a controlled test: we held the model, the prompt and the scorer still, and changed only the question set. Fabrication went from 10.9 percent to 30.9 percent. Real benchmarks also differ in grounding, scoring and number of runs. Add those in, and two measurements of the same model can differ by an order of magnitude.
Can the same AI model have two different hallucination rates?
Yes, and it usually does. Grok 4.3 fabricated 10.9 percent of its citations on 30 general claims, and 30.9 percent on 100 harder domain questions. The prompt and the scorer were the same on both sides. Neither number is wrong; they answer different questions, so both are only meaningful with the corpus attached.
Which AI model hallucinates the least?
It depends on the test, and on most tests the middle of the field cannot be ranked. Look at our nine-model arm, where only 16 of 36 pairs separated at statistical significance. The extremes were real, with fabrication running from 8.3 to 33.1 percent, but the four models in the middle were indistinguishable from each other.
Is a lower hallucination rate always better?
No. A model can lower its fabrication rate by declining to answer. Take our hardest corpus, where the model with the lowest rate answered only 68 percent of the questions and two rivals answered 98 percent. Then we ranked by questions answered with a citation that resolved, and it fell to third. Read the fabrication rate and the answer rate together.
How many runs does a hallucination benchmark need?
More than one. We re-ran an identical test, and it moved our numbers between 1.3 and 7.2 points, depending on the model. On one occasion a single run failed and put a healthy control outside its reference band. That would have sent us hunting a bug that never existed. We run three, and report the pooled figure with a confidence interval.
What counts as a good hallucination rate?
There is no threshold that travels between benchmarks. On grounded summarization the best models sit near 1 to 2 percent. On unaided factual recall the same generation runs from roughly 20 to over 60 percent. Compare a rate only against other models measured on the same corpus, in the same run, by the same scorer.
Does giving the model sources fix hallucination?
It reduces it and does not remove it. Grounded tasks produce the lowest published rates, which is why leaderboards built on them look reassuring. Even there the best performers still fabricate, in a small share of responses. Retrieval adds its own failure: the model cites a real document that does not support the claim.
How do I check a hallucination rate someone quoted at me?
Ask five things: what corpus, grounded or ungrounded, how many runs, what counted as a failure, and who scored it. A rate that cannot answer those is a marketing number. We publish our own figures here: the corpus is named, there are three runs each, and we resolved every DOI against Crossref and DataCite. No model graded them.
Keep reading
Is There a Most Accurate AI Model?
The honest answer is no. The ranking changes with the task, the benchmark, and the month, and even the leader still hallucinates.
The Least Sycophantic AI in Our Benchmark Had Stopped Answering
Two models posted the lowest sycophancy scores in our field, and both had stopped answering. The scorer could not tell the difference.
Claude Fable 5.1 Review: The First Week
A step up on long, hard work, a step sideways on short tasks, and two numbers that mean close to the opposite of how they read.
GPT-6 Astra Review: The First Week
Its 99.9% on ARC-AGI-3 came on OpenAI's own harness. On the neutral one it scored 62.7%.
Are AI Detectors Accurate? They Ask the Wrong Question
They flag honest writers. They mark famous human documents as AI, and OpenAI quietly killed its own detector. But the deeper problem is not that detection is unreliable. It is that 'was this written by AI?' was never the question that protects you.
Stop taking one model's word for it
A single model gives a verdict on your draft. That is one draw from a distribution, exactly like a single benchmark run. TrueStandard checks your text against four or five models in parallel and shows you every claim they disagree on.
TrueStandard is for writers who publish AI-assisted drafts. Paid plans check every claim and citation across four AI models before you hit publish.
Free: one check a day, no signup. Pro is $20 a month for 250 drafts.
Start Verifying →